


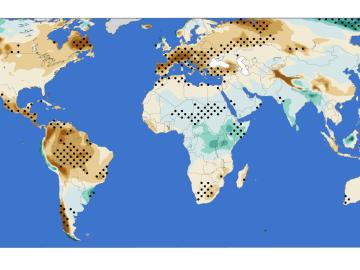
A new analysis from Oak Ridge National Laboratory shows that intensified aridity, or drier atmospheric conditions, is caused by human-driven increases in greenhouse gas emissions. The findings point to an opportunity to address and potentially reverse the trend by reducing emissions.
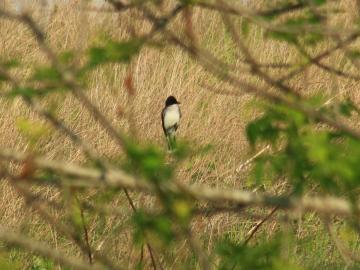
An analysis by Oak Ridge National Laboratory shows that using less-profitable farmland to grow bioenergy crops such as switchgrass could fuel not only clean energy, but also gains in biodiversity.

Oak Ridge National Laboratory researchers have created a technology that more realistically emulates user activities to improve cyber testbeds and ultimately prevent cyberattacks.
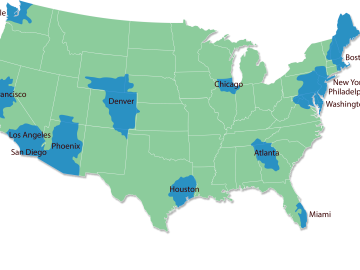
Oak Ridge National Laboratory worked with Colorado State University to simulate how a warming climate may affect U.S. urban hydrological systems.
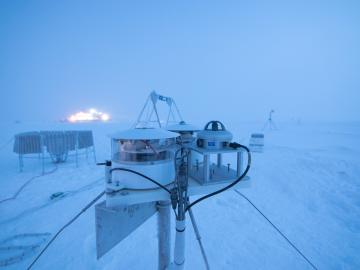
Researchers at Oak Ridge National Laboratory were part of an international team that collected a treasure trove of data measuring precipitation, air particles, cloud patterns and the exchange of energy between the atmosphere and the sea ice.
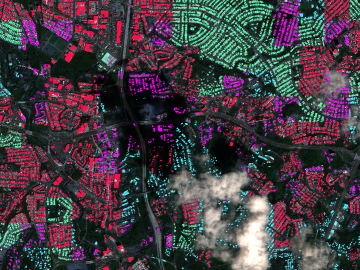
A novel approach developed by scientists at ORNL can scan massive datasets of large-scale satellite images to more accurately map infrastructure – such as buildings and roads – in hours versus days.
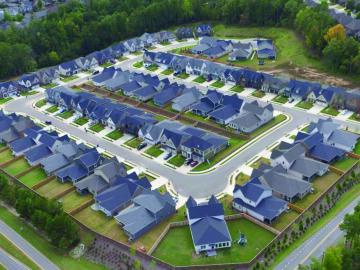
To better determine the potential energy cost savings among connected homes, researchers at Oak Ridge National Laboratory developed a computer simulation to more accurately compare energy use on similar weather days.
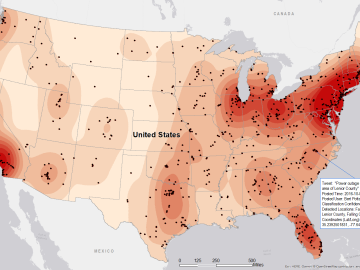
Gleaning valuable data from social platforms such as Twitter—particularly to map out critical location information during emergencies— has become more effective and efficient thanks to Oak Ridge National Laboratory.