Filter News
Area of Research
Date
News Topics
- (-) High-Performance Computing (1)
- 3-D Printing/Advanced Manufacturing (23)
- Artificial Intelligence (1)
- Big Data (1)
- Bioenergy (2)
- Biology (2)
- Biomedical (1)
- Biotechnology (1)
- Buildings (13)
- Chemical Sciences (1)
- Clean Water (4)
- Climate Change (6)
- Composites (9)
- Computer Science (9)
- Coronavirus (2)
- Critical Materials (4)
- Decarbonization (4)
- Energy Storage (21)
- Environment (15)
- Grid (15)
- Hydropower (2)
- Machine Learning (2)
- Materials (12)
- Materials Science (9)
- Mathematics (1)
- Mercury (1)
- Microscopy (2)
- Nanotechnology (1)
- Net Zero (1)
- Nuclear Energy (1)
- Polymers (5)
- Simulation (1)
- Space Exploration (2)
- Statistics (1)
- Sustainable Energy (27)
- Transportation (26)
Media Contacts
![The TRITON model provides a detailed visualization of the flooding that resulted when Hurricane Harvey stalled over Houston for four days in 2017. Credit: Mario Morales-Hernández/ORNL, U.S. Dept. of Energy](/sites/default/files/styles/list_page_thumbnail/public/2021-01/TRITON%20screenshot.png?h=4a7d1ed4&itok=IEra5eDk)
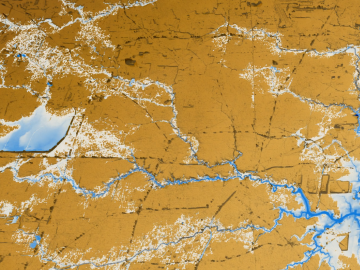
A new tool from Oak Ridge National Laboratory can help planners, emergency responders and scientists visualize how flood waters will spread for any scenario and terrain.