
Quantum precision reached in modeling molten salt behavior

Researchers at Oak Ridge National Laboratory have developed free data sets to estimate how much energy any building in the contiguous U.S. will use in 2100. These data sets provide planners a way to anticipate future energy needs as the climate changes.

ORNL researchers have teamed up with other national labs to develop a free platform called Open Energy Data Initiative Solar Systems Integration Data and Modeling to better analyze the behavior of electric grids incorporating many solar projects.
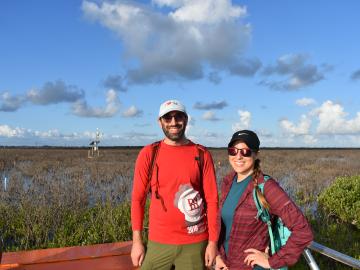
To better understand important dynamics at play in flood-prone coastal areas, Oak Ridge National Laboratory scientists working on simulations of Earth’s carbon and nutrient cycles paid a visit to experimentalists gathering data in a Texas wetland.
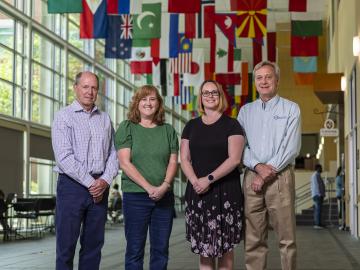
For 25 years, scientists at Oak Ridge National Laboratory have used their broad expertise in human health risk assessment, ecology, radiation protection, toxicology and information management to develop widely used tools and data for the U.S. Environmental Protection Agency as part of the agency’s Superfund program.

Oak Ridge National Laboratory researchers used images from a photo-sharing website to identify crude oil train routes across the nation to provide data that could help transportation planners better understand regional impacts.
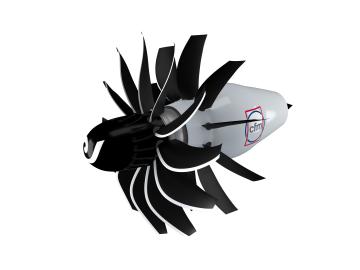
To support the development of a revolutionary new open fan engine architecture for the future of flight, GE Aerospace has run simulations using the world’s fastest supercomputer capable of crunching data in excess of exascale speed, or more than a quintillion calculations per second.
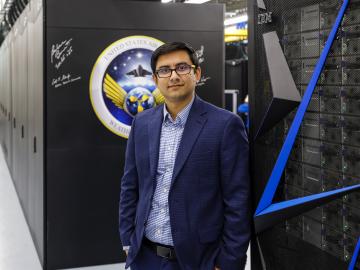
Climate change often comes down to how it affects water, whether it’s for drinking, electricity generation, or how flooding affects people and infrastructure. To better understand these impacts, ORNL water resources engineer Sudershan Gangrade is integrating knowledge ranging from large-scale climate projections to local meteorology and hydrology and using high-performance computing to create a holistic view of the future.
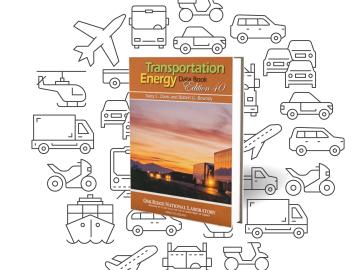
It’s been referenced in Popular Science and Newsweek, cited in the Economic Report of the President, and used by agencies to create countless federal regulations.
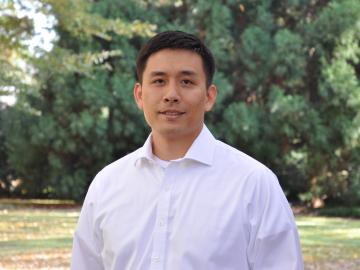
Ross Wang has been intent on resolving traffic jams since he rode a city bus every day through 40 minutes of traffic to get to his elementary school. That daily journey left an impression that would shape his career.
Oak Ridge National Laboratory’s latest Transportation Energy Data Book: Edition 37 reports that the number of vehicles nationwide is growing faster than the population, with sales more than 17 million since 2015, and the average household vehicle travels more than 11,000 miles per year.
