
Quantum precision reached in modeling molten salt behavior

During Hurricanes Helene and Milton, ORNL deployed drone teams and the Mapster platform to gather and share geospatial data, aiding recovery and damage assessments. ORNL's EAGLE-I platform tracked utility outages, helping prioritize recovery efforts. Drone data will train machine learning models for faster damage detection in future disasters.

Researchers at Oak Ridge National Laboratory have developed free data sets to estimate how much energy any building in the contiguous U.S. will use in 2100. These data sets provide planners a way to anticipate future energy needs as the climate changes.
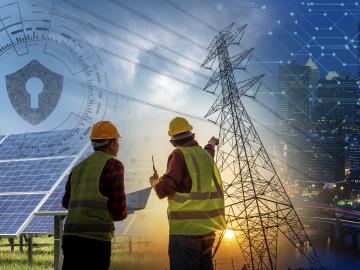
ORNL researchers have teamed up with other national labs to develop a free platform called Open Energy Data Initiative Solar Systems Integration Data and Modeling to better analyze the behavior of electric grids incorporating many solar projects.

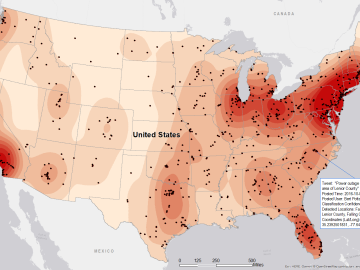
Lee's paper at the August conference in Bellevue, Washington, combined weather and power outage data for three states – Texas, Michigan and Hawaii – and used a machine learning model to predict how extreme weather such as thunderstorms, floods and tornadoes would affect local power grids and to estimate the risk for outages. The paper relied on data from the National Weather Service and the U.S. Department of Energy’s Environment for Analysis of Geo-Located Energy Information, or EAGLE-I, database.
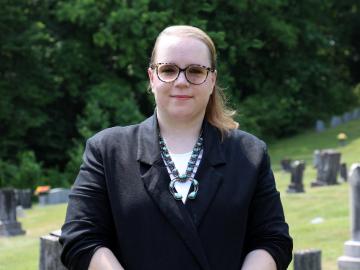
Walters is working with a team of geographers, linguists, economists, data scientists and software engineers to apply cultural knowledge and patterns to open-source data in an effort to document and report patterns of human movement through previously unstudied spaces.
Inspired by one of the mysteries of human perception, an ORNL researcher invented a new way to hide sensitive electric grid information from cyberattack: within a constantly changing color palette.

In human security research, Thomaz Carvalhaes says, there are typically two perspectives: technocentric and human centric. Rather than pick just one for his work, Carvalhaes uses data from both perspectives to understand how technology impacts the lives of people.
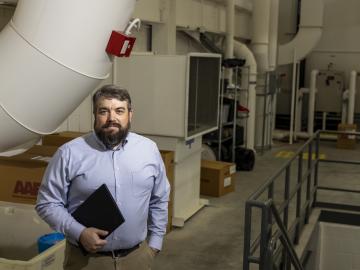
Long before COVID-19’s rapid transmission led to a worldwide pandemic, Oak Ridge National Laboratory’s Jason DeGraw was performing computer modeling to better understand the impact of virus-laden droplets on indoor air quality
Gleaning valuable data from social platforms such as Twitter—particularly to map out critical location information during emergencies— has become more effective and efficient thanks to Oak Ridge National Laboratory.
