ORNL VISTA Data Visualization and Exploration Laboratory
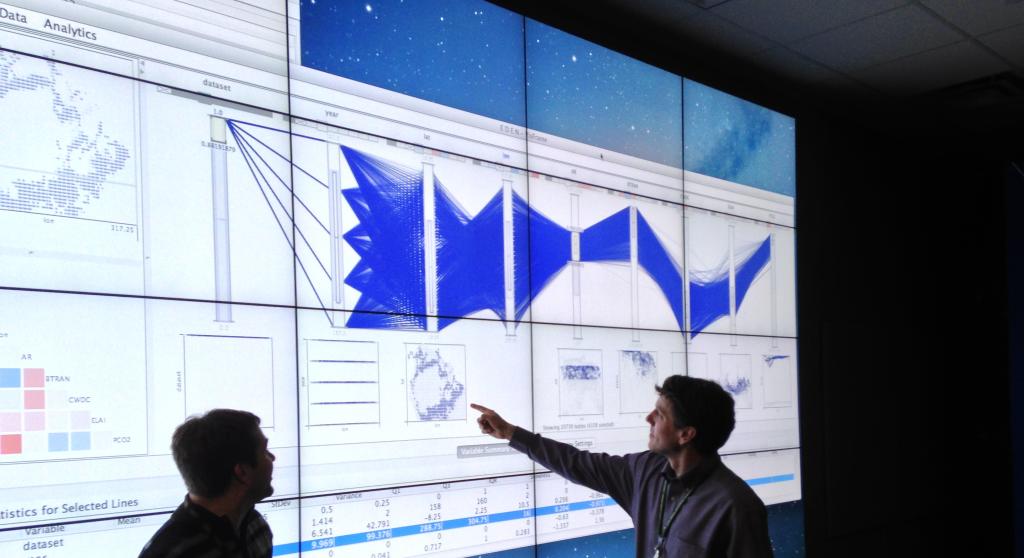
ORNL visual analytics researchers developed EDEN, a multivariate data exploration tool, in close collaboration with climate scientists to help evaluate the results of large scale climate models. Project Lead: Chad Steed
The mission of the ORNL Visual Informatics for Science and Technology Advances (VISTA) Lab is to improve domain experts’ ability to explore large and complex data through the development and application of interactive data visualization and analysis systems. By acting as a bridge connecting ORNL data visualization specialists across multiple directorates to domain-specific data analysis challenges, the VISTA Lab will help improve experts' ability to transform the vast volumes of data generated at ORNL into crucial knowledge in domains of national significance. Successful execution of the VISTA Lab mission will enhance ORNL's reputation as a premiere institution for advanced data analytics research.
ORNL visualization of a seismology simulation, SPECFEM3D_GLOBE, that computes the structures of the interior of the Earth using adjoint tomography. This visualization highlights the slab and subduction zones within the Earth’s mantle. Project Lead: Dave Pugmire
Data exploration is integral to the scientist’s quest to gain a quantitative understanding of their data. Encompassing interactive data visualization and analysis techniques, well-designed visual informatics allow flexible and comprehensive data exploration by integrating human cognition with the computational power of machines. Through years of experience working with experts in a variety of data rich fields, we have observed that the need for a balanced human/machine centered approach in data exploration is universal and interactive data visualizations that are developed in conjunction with automated analytical processes yield effective solutions. When designed in close collaboration with domain experts, visual informatics systems can lead to new depths of understanding through a process that guides scientists to significant, and sometimes unforeseen, discoveries.
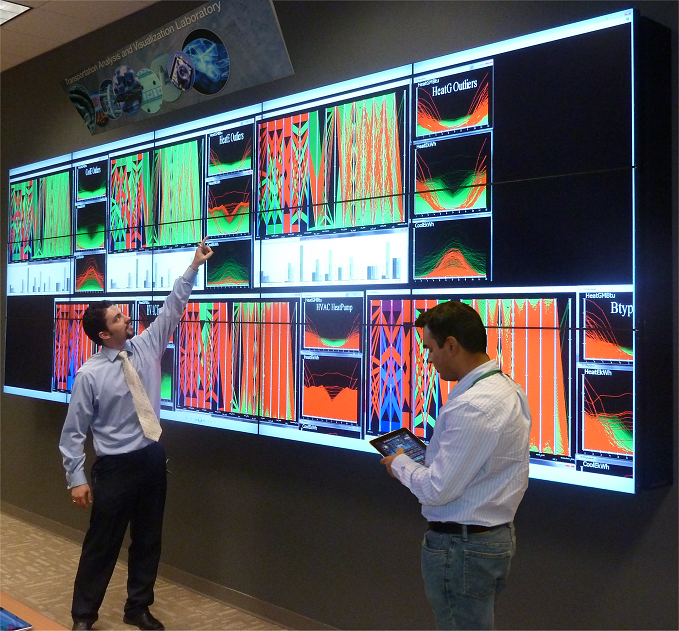
Joshua New and Jibo Sanyal are shown here exercising the capabilities of the Transportation Analysis and Visualization Laboratory (TRAVL) with a variety of information visualization techniques. Project Leads: Joshua New and Jibo Sanyal
The ORNL VISTA Lab will serve as a hub for ORNL data visualization expertise by building a community that spans directorates, sharing knowledge, and fostering collaboration. We will also make fundamental contributions to data visualization, visual analytics, and related subfields by engaging in co-design projects with both ORNL domain experts and academic collaborators to solve the specific data analysis challenges.
Initially, the VISTA Lab will offer three main services:
- Develop and evaluate both new and existing data visualization techniques in domain specific applications
- Establish an innovative visualization laboratory with interactive displays and data analysis software for experts to collaboratively explore data
- Provide consulting expertise (data visualization, data wrangling and exploration, and visualization laboratory design) to ORNL domain experts by connecting them to data visualization specialists from multiple directorates