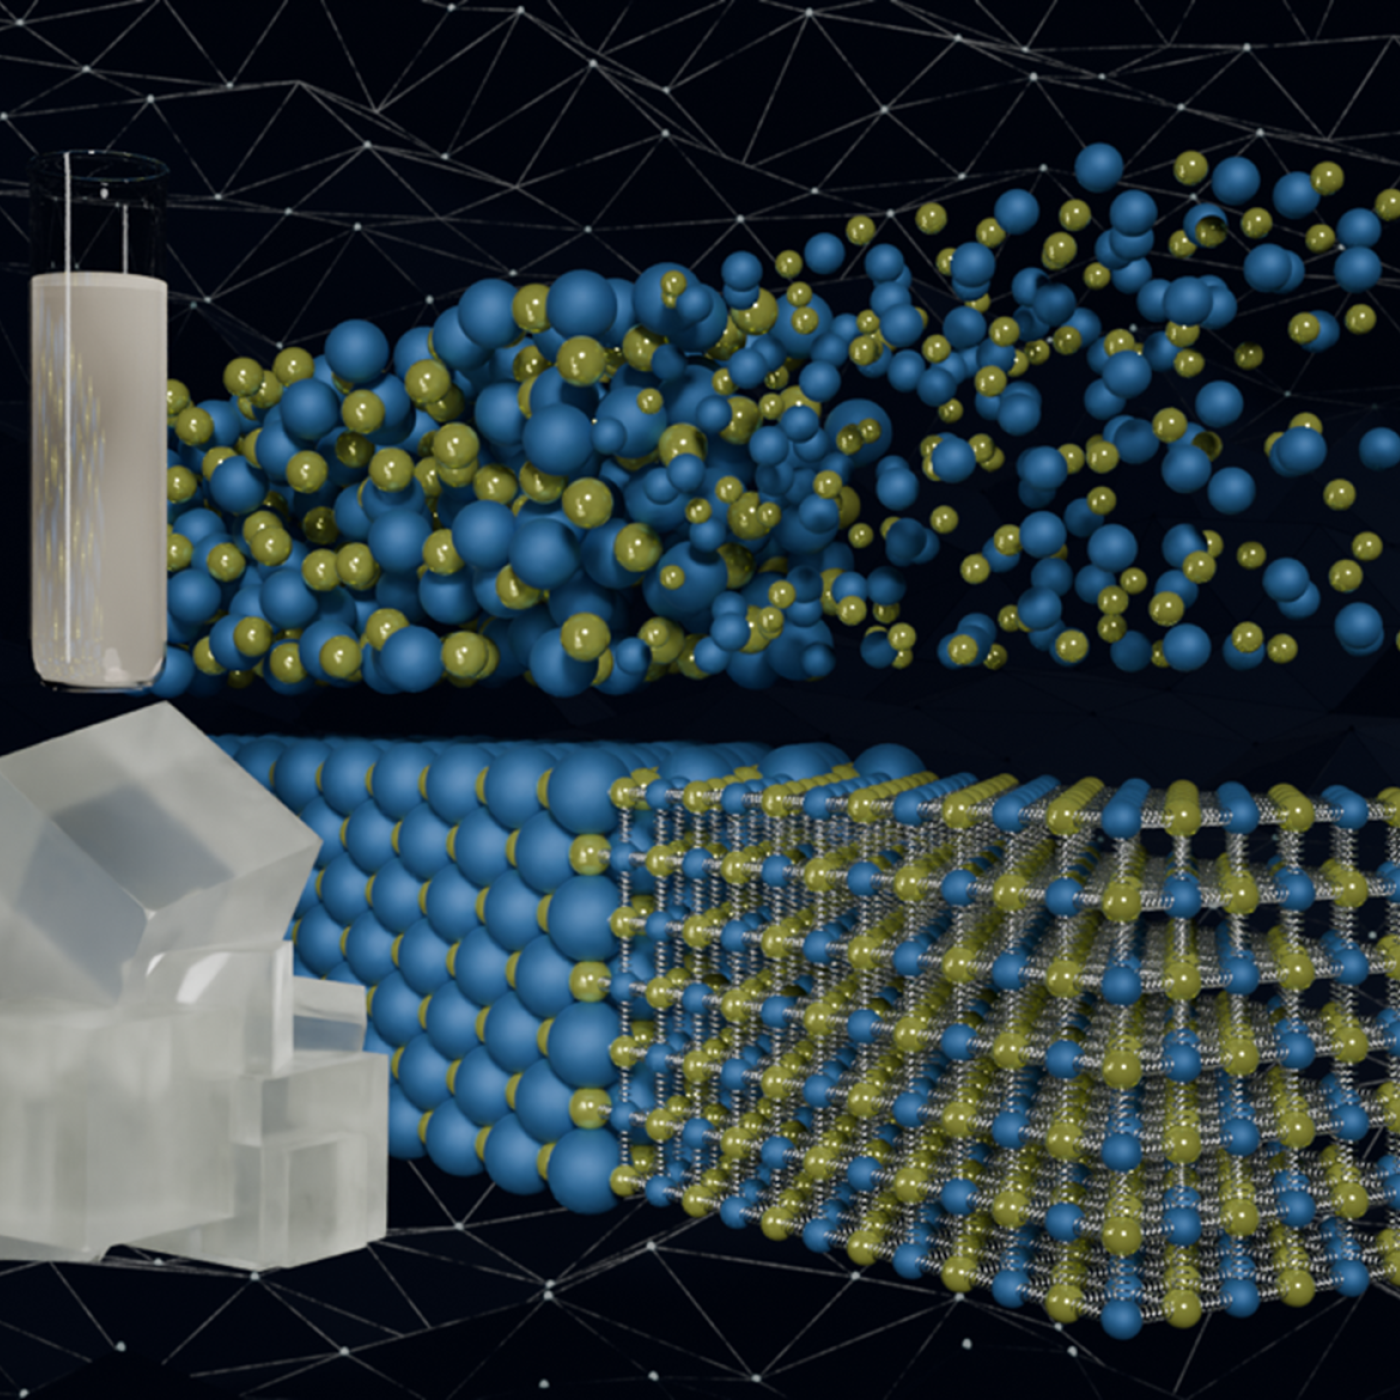
Illustration of the GRETA detector, a spherical array of metal cylinders. The detector is divided into two halves to show the inside of the machine. Both halves are attached to metal harnesses, displayed against a black and green cyber-themed background.

Analyzing massive datasets from nuclear physics experiments can take hours or days to process, but researchers are working to radically reduce that time to mere seconds using special software being developed at the Department of Energy’s Lawrence Berkeley and Oak Ridge national laboratories.  

ORNL seismic researcher Chengping Chai placed seismic sensors on the ground at various distances from an ORNL nuclear reactor to learn whether they could detect its operating state. Credit: Carlos Jones/ORNL, U.S. Dept. of Energy

Like most scientists, Chengping Chai is not content with the surface of things: He wants to probe beyond to learn what’s really going on. But in his case, he is literally building a map of the world beneath, using seismic and acoustic data that reveal when and where the earth moves.

The image shows a visualization of a radiation transport simulation for a spaceflight radioisotope power system and complex interactions of radiation fields with operational environments. Credit: Michael B. R. Smith and M. Scott Greenwood/ORNL, U.S. Dept. of Energy

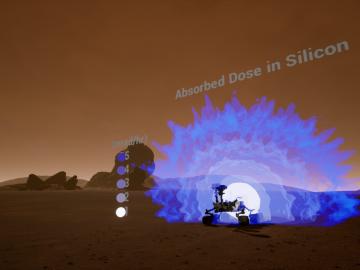
Researchers at Oak Ridge National Laboratory are developing a first-of-a-kind toolkit drawing on video game development software to visualize radiation data.

Germina Ilas (left) and Ian Gauld review spent fuel data entries in the SFCOMPO 2.0 database.
Oak Ridge National Laboratory provided significant contributions and coordination in the development of the Nuclear Energy Agency’s (NEA’s) recently released Spent Fuel Isotopic Composition (SFCOMPO) 2.0—the world’s largest open database for spent