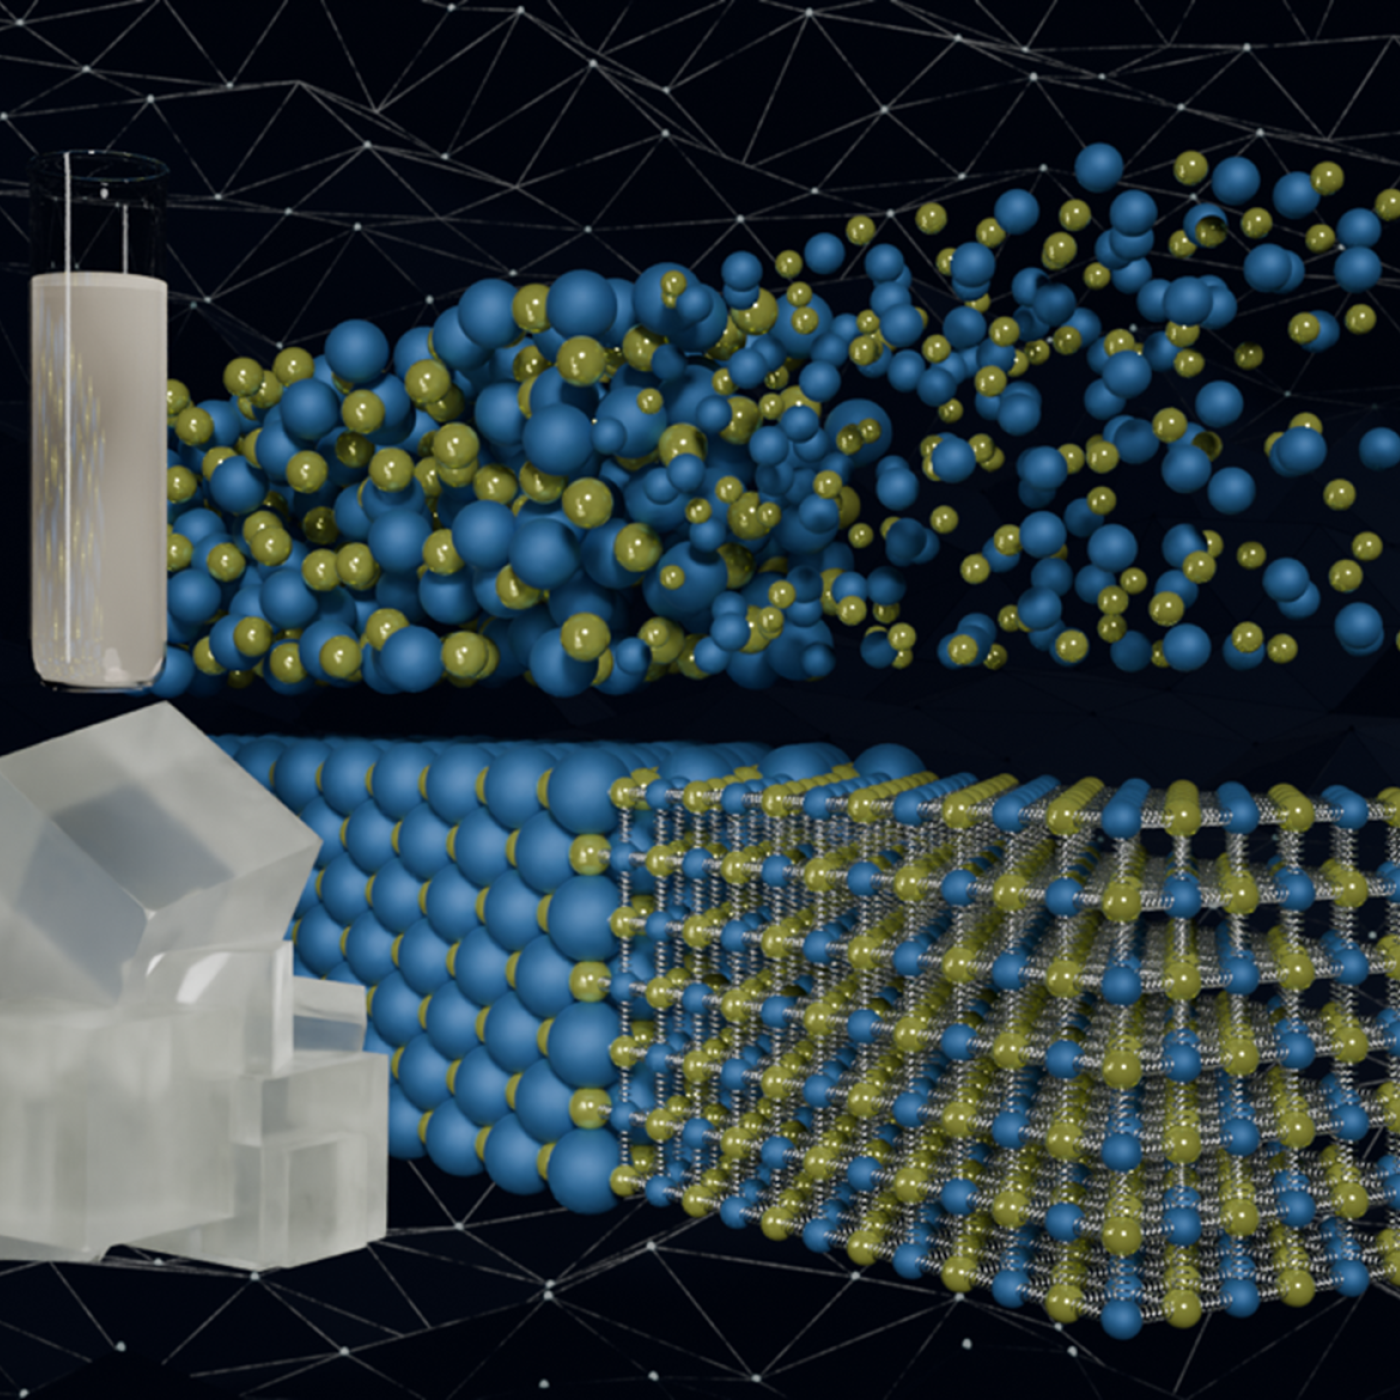
Quantum precision reached in modeling molten salt behavior

Analyzing massive datasets from nuclear physics experiments can take hours or days to process, but researchers are working to radically reduce that time to mere seconds using special software being developed at the Department of Energy’s Lawrence Berkeley and Oak Ridge national laboratories.

Like most scientists, Chengping Chai is not content with the surface of things: He wants to probe beyond to learn what’s really going on. But in his case, he is literally building a map of the world beneath, using seismic and acoustic data that reveal when and where the earth moves.
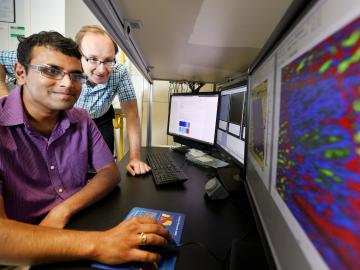
At the Department of Energy’s Oak Ridge National Laboratory, scientists use artificial intelligence, or AI, to accelerate the discovery and development of materials for energy and information technologies.
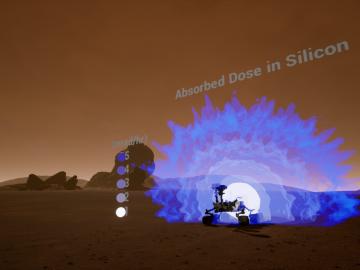
Researchers at Oak Ridge National Laboratory are developing a first-of-a-kind toolkit drawing on video game development software to visualize radiation data.
Seven ORNL scientists have been named among the 2020 Highly Cited Researchers list, according to Clarivate, a data analytics firm that specializes in scientific and academic research.

From materials science and earth system modeling to quantum information science and cybersecurity, experts in many fields run simulations and conduct experiments to collect the abundance of data necessary for scientific progress.
Students often participate in internships and receive formal training in their chosen career fields during college, but some pursue professional development opportunities even earlier.
 and Ian Gauld review spent fuel data entries in the SFCOMPO 2.0 database.")
