
Quantum precision reached in modeling molten salt behavior

During Hurricanes Helene and Milton, ORNL deployed drone teams and the Mapster platform to gather and share geospatial data, aiding recovery and damage assessments. ORNL's EAGLE-I platform tracked utility outages, helping prioritize recovery efforts. Drone data will train machine learning models for faster damage detection in future disasters.

A study led by the Department of Energy’s Oak Ridge National Laboratory details how artificial intelligence researchers created an AI model to help identify new alloys used as shielding for housing fusion applications components in a nuclear reactor. The findings mark a major step towards improving nuclear fusion facilities.

ORNL scientists develop a sample holder that tumbles powdered photochemical materials within a neutron beamline — exposing more of the material to light for increased photo-activation and better photochemistry data capture.

ORNL researchers have teamed up with other national labs to develop a free platform called Open Energy Data Initiative Solar Systems Integration Data and Modeling to better analyze the behavior of electric grids incorporating many solar projects.

Lee's paper at the August conference in Bellevue, Washington, combined weather and power outage data for three states – Texas, Michigan and Hawaii – and used a machine learning model to predict how extreme weather such as thunderstorms, floods and tornadoes would affect local power grids and to estimate the risk for outages. The paper relied on data from the National Weather Service and the U.S. Department of Energy’s Environment for Analysis of Geo-Located Energy Information, or EAGLE-I, database.
Inspired by one of the mysteries of human perception, an ORNL researcher invented a new way to hide sensitive electric grid information from cyberattack: within a constantly changing color palette.

In human security research, Thomaz Carvalhaes says, there are typically two perspectives: technocentric and human centric. Rather than pick just one for his work, Carvalhaes uses data from both perspectives to understand how technology impacts the lives of people.
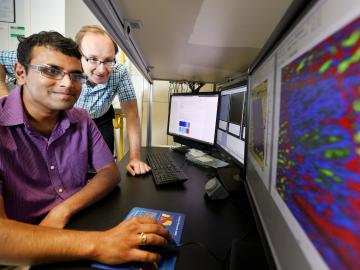
At the Department of Energy’s Oak Ridge National Laboratory, scientists use artificial intelligence, or AI, to accelerate the discovery and development of materials for energy and information technologies.
Seven ORNL scientists have been named among the 2020 Highly Cited Researchers list, according to Clarivate, a data analytics firm that specializes in scientific and academic research.

From materials science and earth system modeling to quantum information science and cybersecurity, experts in many fields run simulations and conduct experiments to collect the abundance of data necessary for scientific progress.
