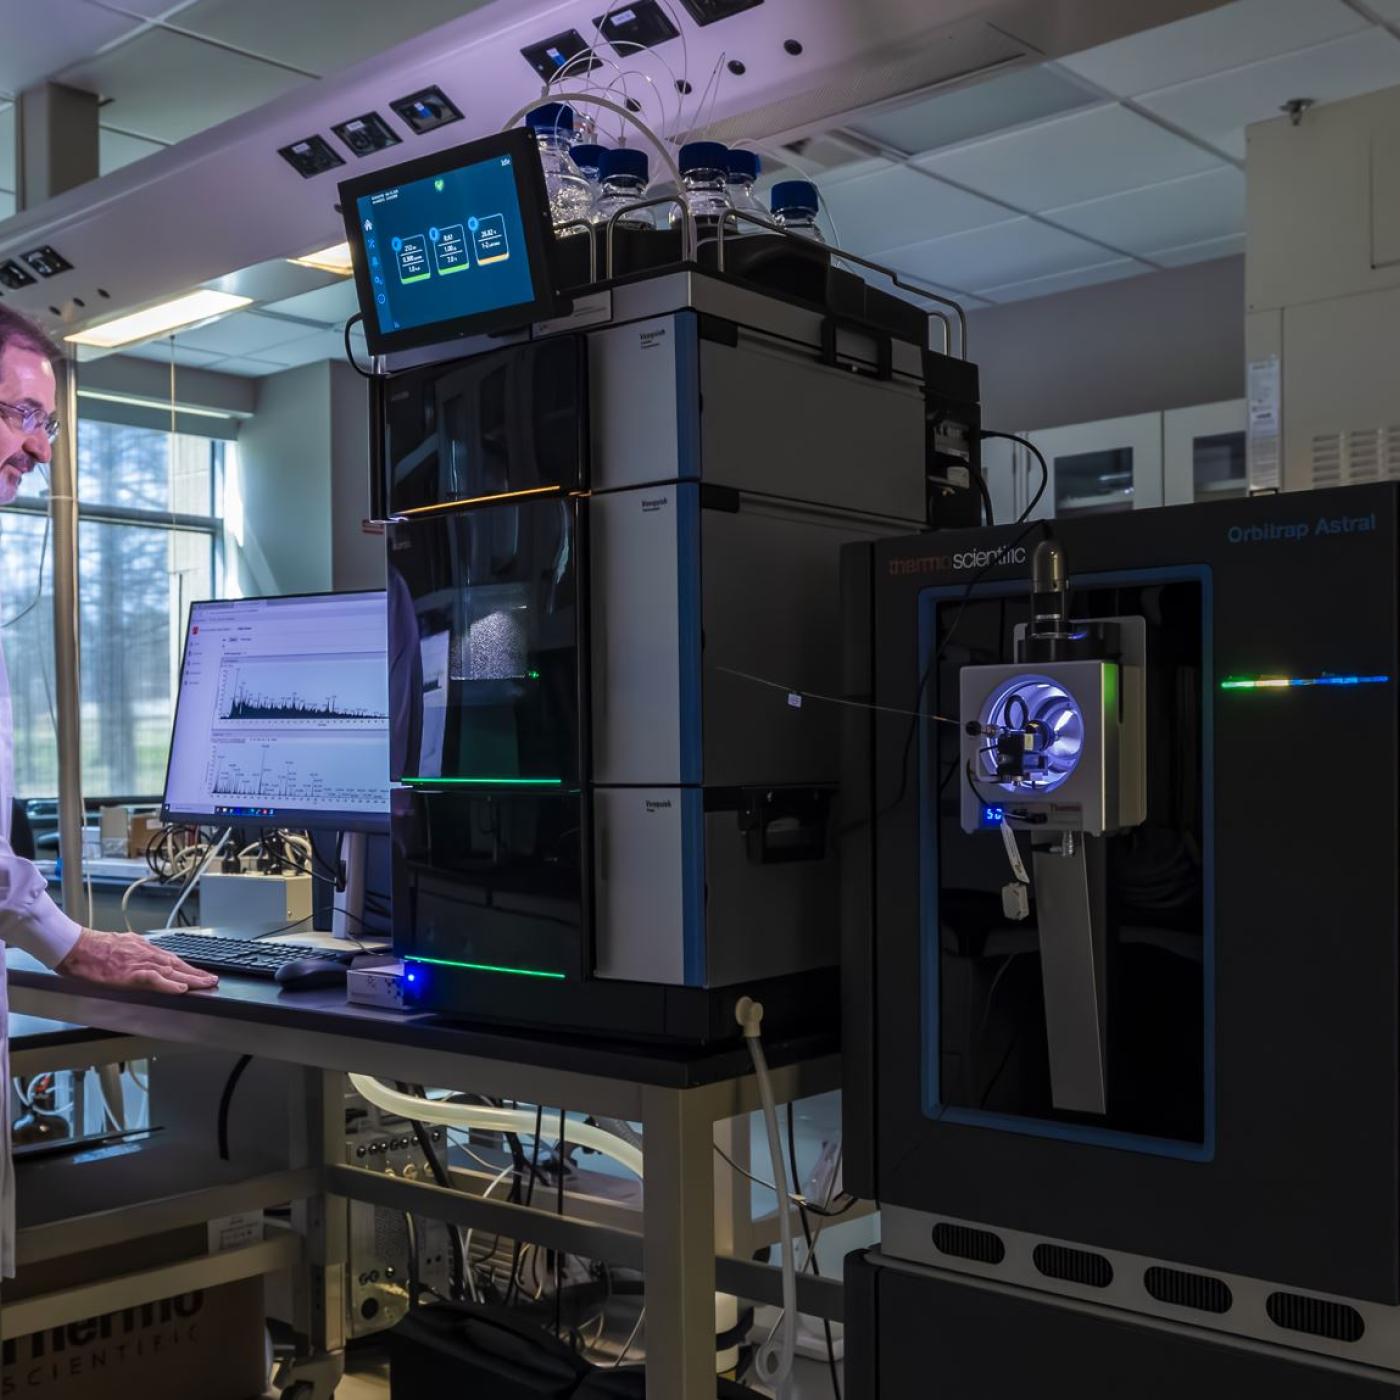
Robert Hettich: Decoding biological complexity with next-gen mass spectrometry
Inspired by one of the mysteries of human perception, an ORNL researcher invented a new way to hide sensitive electric grid information from cyberattack: within a constantly changing color palette.
Climate change often comes down to how it affects water, whether it’s for drinking, electricity generation, or how flooding affects people and infrastructure. To better understand these impacts, ORNL water resources engineer Sudershan Gangrade is integrating knowledge ranging from large-scale climate projections to local meteorology and hydrology and using high-performance computing to create a holistic view of the future.
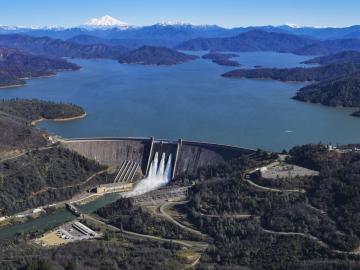
ORNL has provided hydropower operators with new data to better prepare for extreme weather events and shifts in seasonal energy demands caused by climate change.

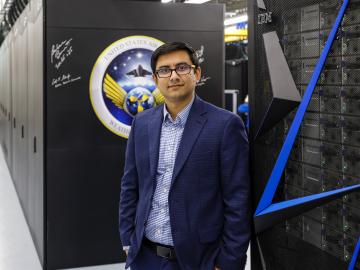
A team of collaborators from ORNL, Google Inc., Snowflake Inc. and Ververica GmbH has tested a computing concept that could help speed up real-time processing of data that stream on mobile and other electronic devices.
From materials science and earth system modeling to quantum information science and cybersecurity, experts in many fields run simulations and conduct experiments to collect the abundance of data necessary for scientific progress.