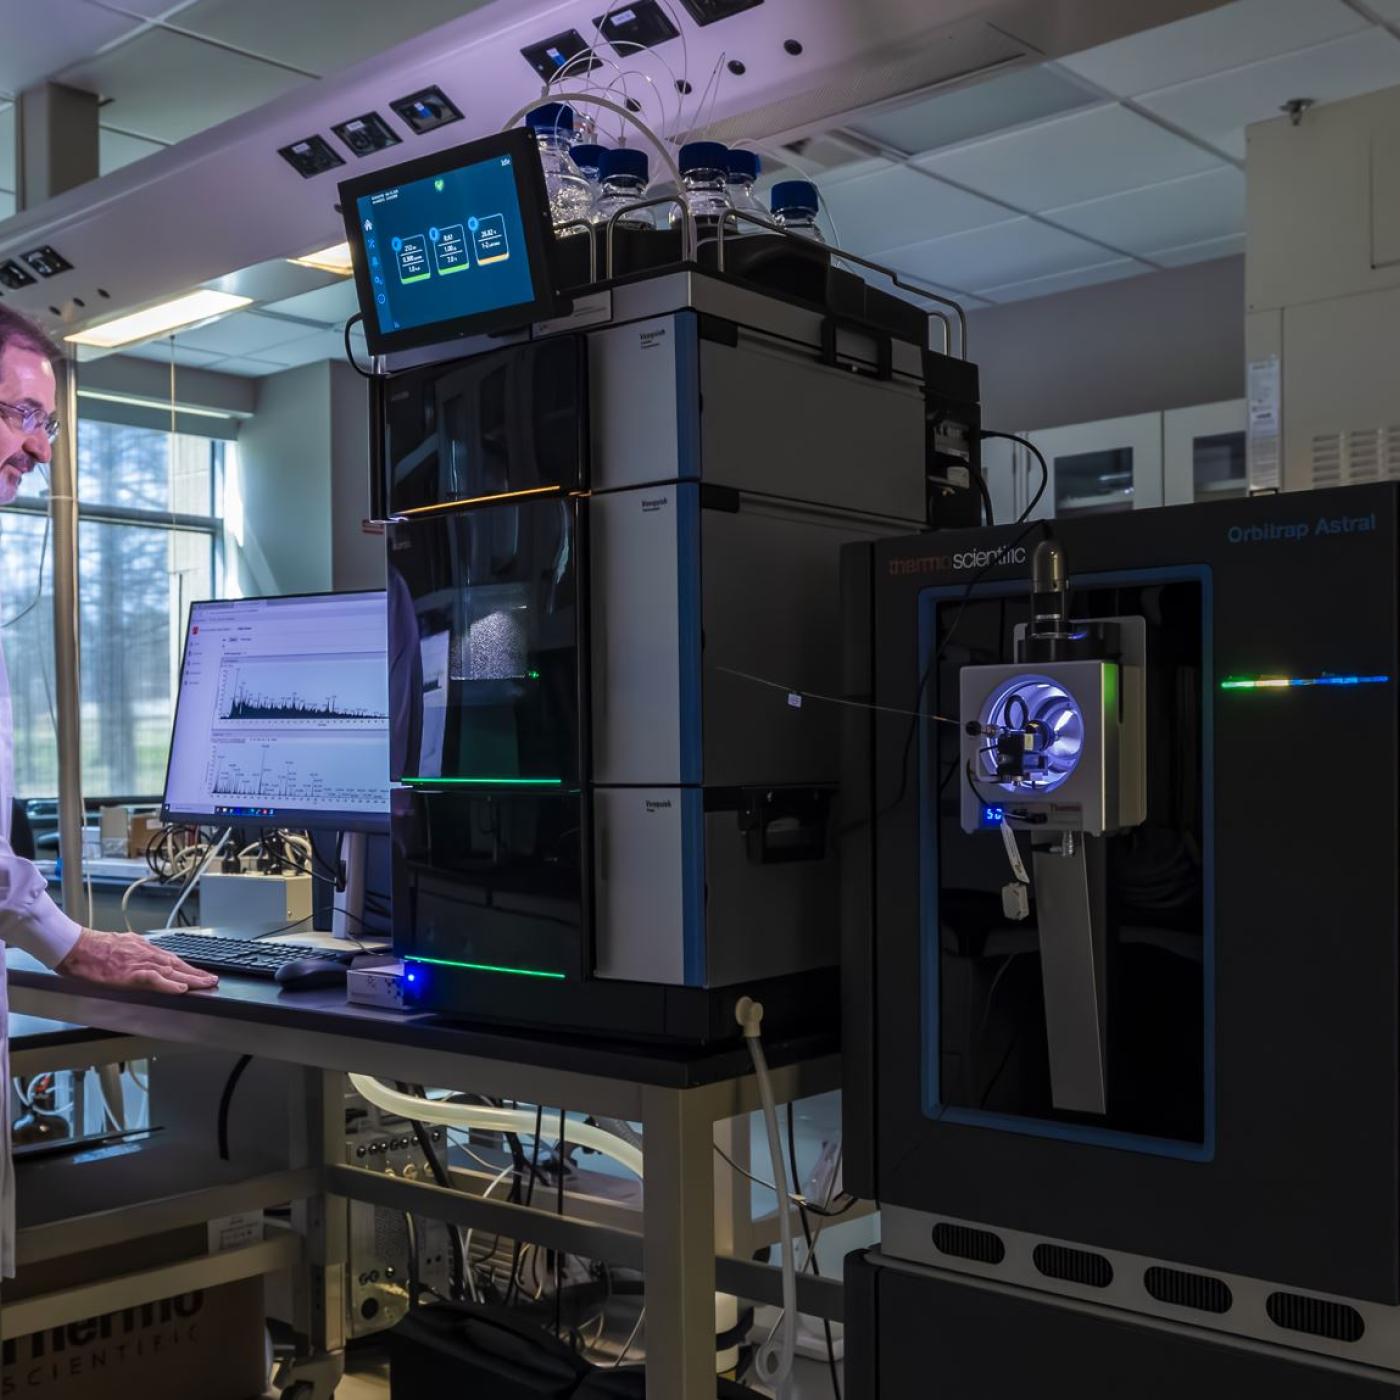
Robert Hettich: Decoding biological complexity with next-gen mass spectrometry
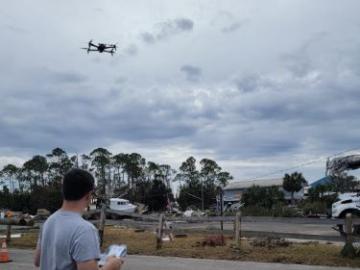
During Hurricanes Helene and Milton, ORNL deployed drone teams and the Mapster platform to gather and share geospatial data, aiding recovery and damage assessments. ORNL's EAGLE-I platform tracked utility outages, helping prioritize recovery efforts. Drone data will train machine learning models for faster damage detection in future disasters.

ORNL researchers have teamed up with other national labs to develop a free platform called Open Energy Data Initiative Solar Systems Integration Data and Modeling to better analyze the behavior of electric grids incorporating many solar projects.

Lee's paper at the August conference in Bellevue, Washington, combined weather and power outage data for three states – Texas, Michigan and Hawaii – and used a machine learning model to predict how extreme weather such as thunderstorms, floods and tornadoes would affect local power grids and to estimate the risk for outages. The paper relied on data from the National Weather Service and the U.S. Department of Energy’s Environment for Analysis of Geo-Located Energy Information, or EAGLE-I, database.
Inspired by one of the mysteries of human perception, an ORNL researcher invented a new way to hide sensitive electric grid information from cyberattack: within a constantly changing color palette.

In human security research, Thomaz Carvalhaes says, there are typically two perspectives: technocentric and human centric. Rather than pick just one for his work, Carvalhaes uses data from both perspectives to understand how technology impacts the lives of people.

A team of collaborators from ORNL, Google Inc., Snowflake Inc. and Ververica GmbH has tested a computing concept that could help speed up real-time processing of data that stream on mobile and other electronic devices.
From materials science and earth system modeling to quantum information science and cybersecurity, experts in many fields run simulations and conduct experiments to collect the abundance of data necessary for scientific progress.
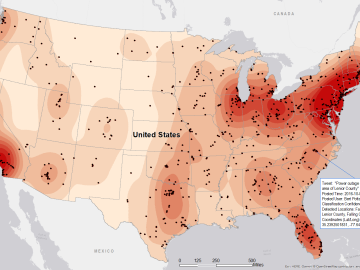
Gleaning valuable data from social platforms such as Twitter—particularly to map out critical location information during emergencies— has become more effective and efficient thanks to Oak Ridge National Laboratory.