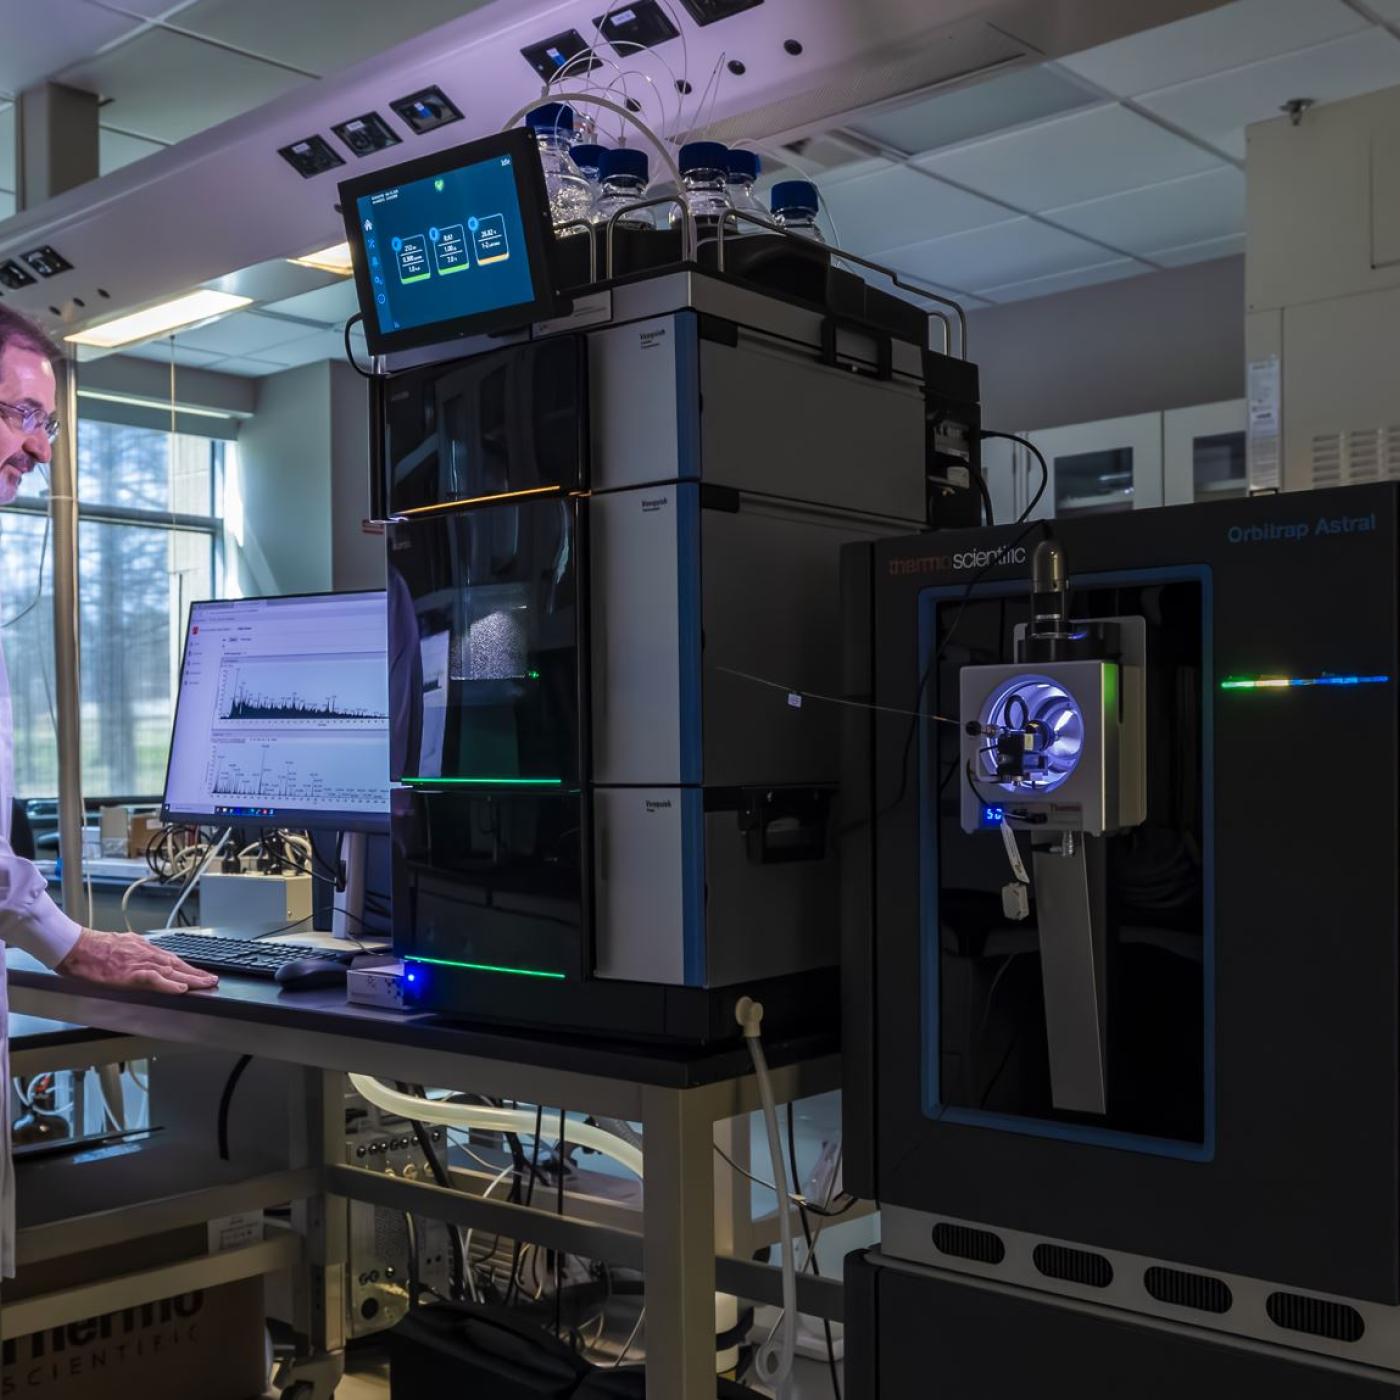
Robert Hettich: Decoding biological complexity with next-gen mass spectrometry
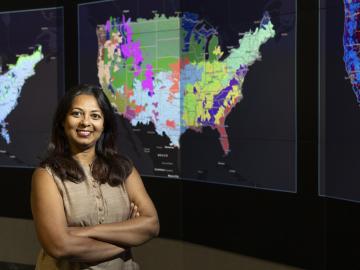
Debjani Singh, a senior scientist at ORNL, leads the HydroSource project, which enhances hydropower research by making water data more accessible and useful. With a background in water resources, data science, and earth science, Singh applies innovative tools like AI to advance research. Her career, shaped by her early exposure to science in India, focuses on bridging research with practical applications.
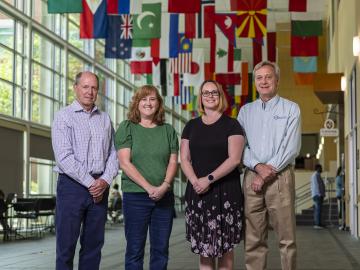
For 25 years, scientists at Oak Ridge National Laboratory have used their broad expertise in human health risk assessment, ecology, radiation protection, toxicology and information management to develop widely used tools and data for the U.S. Environmental Protection Agency as part of the agency’s Superfund program.
Inspired by one of the mysteries of human perception, an ORNL researcher invented a new way to hide sensitive electric grid information from cyberattack: within a constantly changing color palette.

A team of collaborators from ORNL, Google Inc., Snowflake Inc. and Ververica GmbH has tested a computing concept that could help speed up real-time processing of data that stream on mobile and other electronic devices.
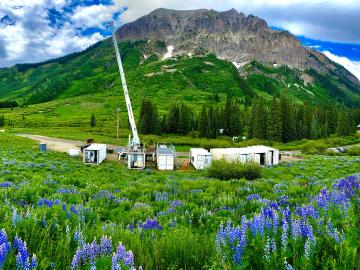
New data hosted through the Atmospheric Radiation Measurement Data Center at Oak Ridge National Laboratory will help improve models that predict climate change effects on the water supply in the Colorado River Basin.
From materials science and earth system modeling to quantum information science and cybersecurity, experts in many fields run simulations and conduct experiments to collect the abundance of data necessary for scientific progress.