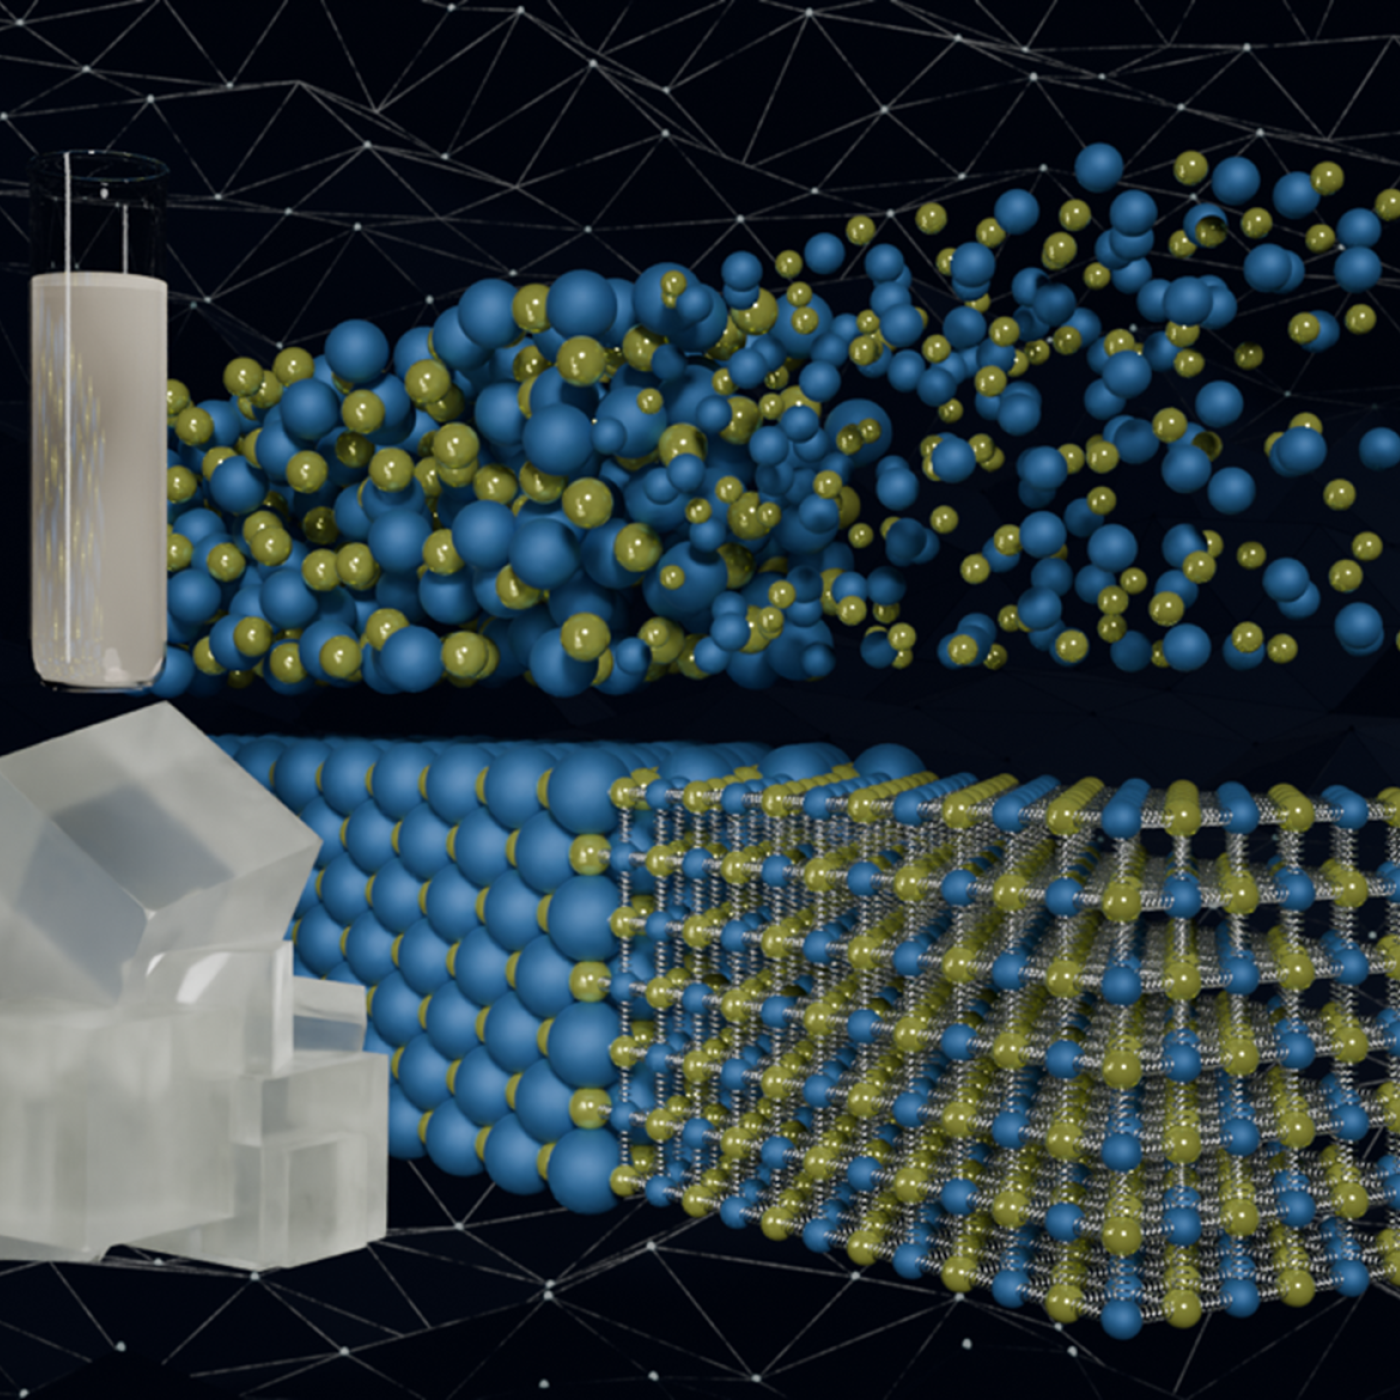
Quantum precision reached in modeling molten salt behavior

A new Global Biomass Resource Assessment developed by ORNL scientists gathered data from 55 countries resulting in a first-of-its kind compilation of current and future sustainable biomass supply estimates around the world.
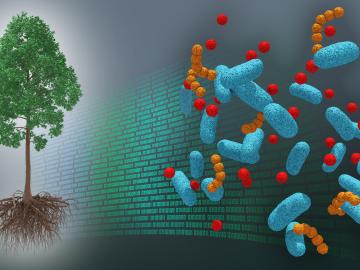
A first-ever dataset bridging molecular information about the poplar tree microbiome to ecosystem-level processes has been released by a team of DOE scientists led by ORNL. The project aims to inform research regarding how natural systems function, their vulnerability to a changing climate and ultimately how plants might be engineered for better performance as sources of bioenergy and natural carbon storage.
Inspired by one of the mysteries of human perception, an ORNL researcher invented a new way to hide sensitive electric grid information from cyberattack: within a constantly changing color palette.

A team of collaborators from ORNL, Google Inc., Snowflake Inc. and Ververica GmbH has tested a computing concept that could help speed up real-time processing of data that stream on mobile and other electronic devices.

From materials science and earth system modeling to quantum information science and cybersecurity, experts in many fields run simulations and conduct experiments to collect the abundance of data necessary for scientific progress.
