
Quantum precision reached in modeling molten salt behavior
Researchers at the Department of Energy’s Oak Ridge National Laboratory are using non-weather data from the nationwide weather radar network to understand how to track non-meteorological events moving through the air for better emergency response.

During Hurricanes Helene and Milton, ORNL deployed drone teams and the Mapster platform to gather and share geospatial data, aiding recovery and damage assessments. ORNL's EAGLE-I platform tracked utility outages, helping prioritize recovery efforts. Drone data will train machine learning models for faster damage detection in future disasters.

The Department of Energy’s Office of Electricity, in partnership with ORNL, has launched an experimental platform for energy sector-related data with enhanced emphasis on governance and usability.

ORNL and NASA co-hosted the fourth iteration of this invitation-only event, which brings together geospatial, computational, data and engineering experts around a theme. This year’s gathering focused on how artificial intelligence foundation models can enable geospatial digital twins.

To bridge the gap between experimental facilities and supercomputers, experts from SLAC National Accelerator Laboratory are teaming up with other DOE national laboratories to build a new data streaming pipeline. The pipeline will allow researchers to send their data to the nation’s leading computing centers for analysis in real time even as their experiments are taking place.

On Feb. 15, 2024, the one billionth item, also known as an “occupancy,” was scanned at the Port of Aqaba, Jordan, one of the early sites where radiation detection equipment was installed. This milestone shows the extent of countries committed to preventing the spread of radioactive material through the amount of data volunteered to ORNL for continuous improvement. As adversaries push the limits of smuggling dangerous material, this collaboration pushes back through science-backed analysis.
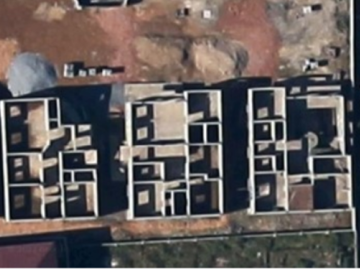
Researchers at ORNL are using satellite images of homes under construction to address gaps in census data, especially in areas like Sub-Saharan Africa. By analyzing these images, they estimate dwelling sizes and population densities where traditional data is sparse. This method improves population estimates and supports national security by enhancing emergency response capabilities.
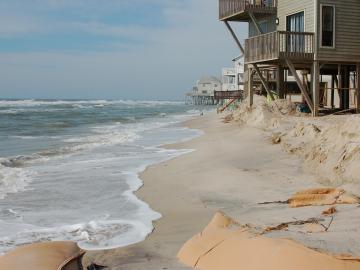
A study found that beaches with manmade fortifications recover more slowly from hurricanes than natural beaches, losing more sand and vegetation. The researchers used satellite images and light detection and ranging data, or LIDAR, to measure elevation changes and vegetation coverage. Changes in elevation showed how much sand was depleted during the storm and how much sand returned throughout the following year.
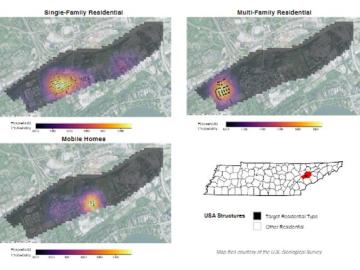
Joe Tuccillo, a human geography research scientist, leads the UrbanPop project that uses census data to create synthetic populations. Using a Python software suite called Likeness on ORNL’s high-performance computers, Tuccillo’s team generates a population with individual ‘agents’ designed to represent people that interact with other agents, facilities and services in a simulated neighborhood.
As a data scientist, Daniel Adams uses storytelling to parse through a large amount of information to determine which elements are most important, paring down the data to result in the most efficient and accurate data set possible.
