

When Matt McCarthy saw an opportunity for a young career scientist to influence public policy, he eagerly raised his hand.

When the COVID-19 pandemic stunned the world in 2020, researchers at ORNL wondered how they could extend their support and help
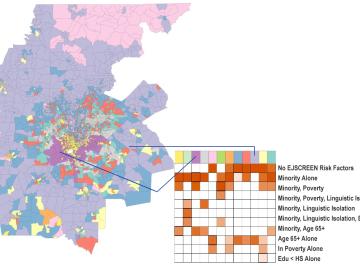
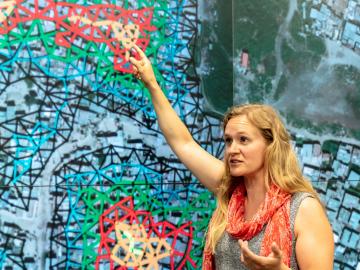
Scientists develop environmental justice lens to identify neighborhoods vulnerable to climate change
A new capability to identify urban neighborhoods, down to the block and building level, that are most vulnerable to climate change could help ensure that mitigation and resilience programs reach the people who need them the most.
ORNL researchers used the nation’s fastest supercomputer to map the molecular vibrations of an important but little-studied uranium compound produced during the nuclear fuel cycle for results that could lead to a cleaner, safer world.

Tackling the climate crisis and achieving an equitable clean energy future are among the biggest challenges of our time.
Unequal access to modern infrastructure is a feature of growing cities, according to a study published this week in the Proceedings of the National Academy of Sciences
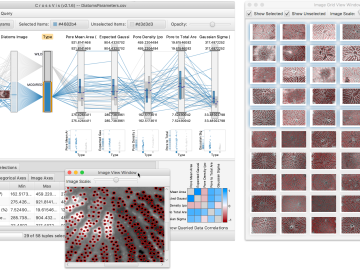
From materials science and earth system modeling to quantum information science and cybersecurity, experts in many fields run simulations and conduct experiments to collect the abundance of data necessary for scientific progress.