
A detailed study by Oak Ridge National Laboratory estimated how much more—or less—energy United States residents might consume by 2050 relative to predicted shifts in seasonal weather patterns
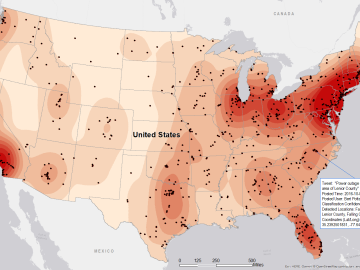
Gleaning valuable data from social platforms such as Twitter—particularly to map out critical location information during emergencies— has become more effective and efficient thanks to Oak Ridge National Laboratory.